
Seven housing markets around the nation were described as buyer’s markets because they had at least six months of supply in June, according to a recent report from Realtor.com.
Three markets in particular, Miami and Orlando in Florida as well as Austin, Texas, were standouts as they had the nation’s highest months of supply in June. This means that buyers in those markets had the most leverage, according to the online real estate marketplace.
Miami topped the list of buyer market cities out of all 50 metros tracked by the firm. The city had 9.7 months’ supply in June, meaning it would take nearly 10 months to sell all of its listings at the current pace. That inventory is up 35% compared with the same period in 2024.
HOME PRICES REACH RECORD HIGH IN JUNE – THESE STATES ARE THE MOST EXPENSIVE
The median list price at the time was $510,000, which is 4.7% lower than the previous year.
In Austin, Texas, which ranked as the second-best market for buyers, there was 7.7 months’ supply in June. The reason this city landed as one the best cities is because buyer demand softened following the COVID-19 pandemic boom, but the total number of for-sale homes skyrocketed, according to Realtor.com. Austin had the second-greatest inventory increase compared with its pre-pandemic levels, according to Realtor.com. Nearly 33% of its listings also saw price cuts in June.

MORE LUXURY HOMEBUYERS PAYING WITH CASH THIS YEAR, REPORT SAYS
The typical home in the Texas city was under $500,000, down 4.8% from a year ago, according to Realtor.com.
THESE STATES SEE THE MOST ALL-CASH HOME PURCHASES
In Orlando, there was 6.9 months’ of supply in June, making it the third-best market for buyers. The metro’s for-sale inventory jumped nearly 34% year over year and the median listing price in Orlando also decreased 3.4% to $429,473.
The city has been a buyer’s market since January when its supply surpassed six months.
Realtor.com senior economist Jake Krimmel said all of the seven buyer-friendly metros have the same things in common: rising inventory and a slowing pace of sales, meaning that more sellers are competing across fewer buyers.
Krimmel said that, regionally, this aligns with much of Reatlor.com’s analysis over the past several months.
“The housing market is particularly weak in the South and West, but especially in Florida. Seeing all four major Florida metros as buyer’s markets was not surprising,” Krimmel said. “Rather, this corroborates much of the softness we have been seeing when it comes to rising inventory, longer time on market and more price cuts and falling list prices and lagging new listing growth in those metros.”

Krimmel said there is also predictive power in months of supply when it comes to where prices will move in the future. For instance, each of our seven buyer’s markets in June saw year-on-year price-per-square-foot declines in August. Notably, Miami saw a 3.9% decline, Austin saw a 3.5% decline and New York also had a 3.5% decline.
The top seven buyer markets, according to Realtor.com:
Miami-Fort Lauderdale-West Palm Beach, Florida
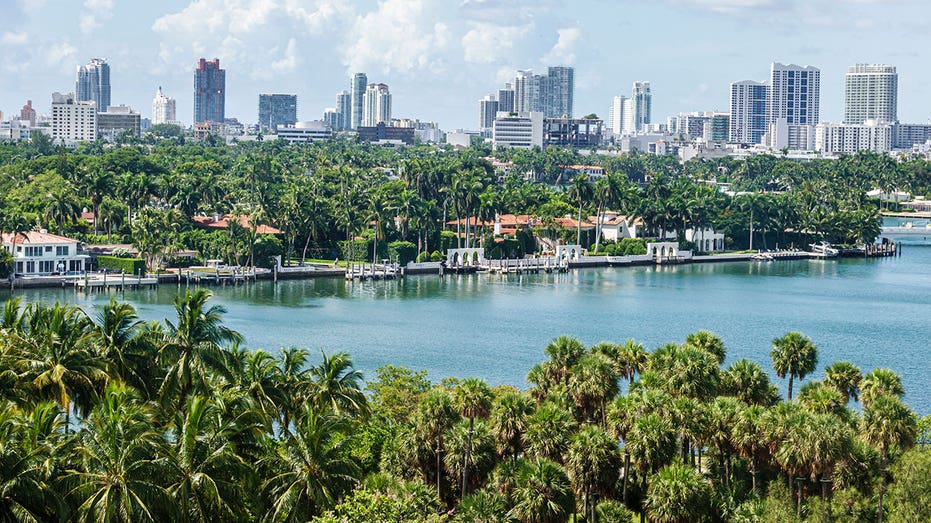
- Active Listing Count year over year: +24.3%
- New Listing Count year over year: -8.3%
- Median List Price: $500,000
- Median List Price year over year: -5.7%
- Months of Supply (June 2025): 9.7
Austin-Round Rock-San Marcos, Texas

- Active Listing Count year over year: +15.4%
- New Listing Count year over year: +3.6%
- Median List Price: $499,000
- Median List Price year over year: -5.0%
- Months of Supply (June 2025): 7.1
Orlando-Kissimmee-Sanford, Florida
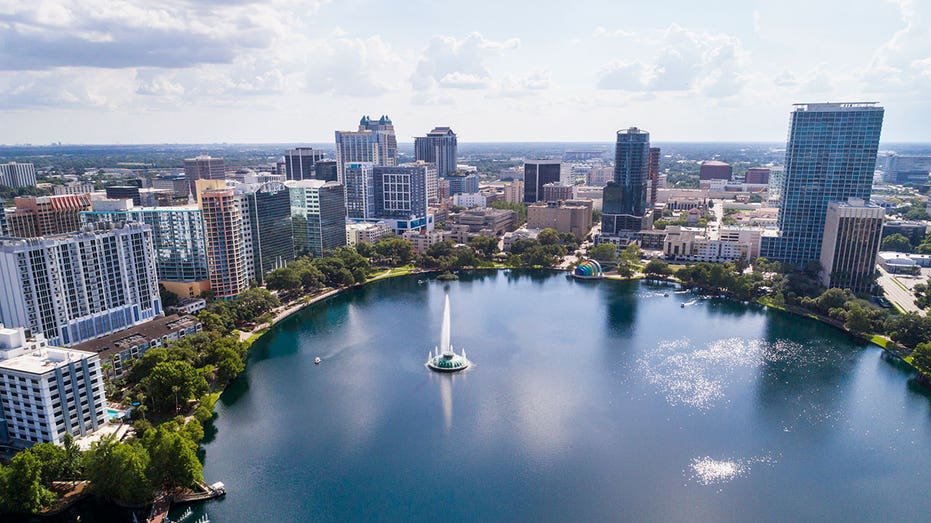
- Active Listing Count year over year: +19.5%
- New Listing Count year over year: -10.7%
- Median List Price: $422,695
- Median List Price year over year: -2.8%
- Months of Supply (June 2025): 6.9
New York-Newark-Jersey City, New York-New Jersey

- Active Listing Count year over year: +7.7%
- New Listing Count year over year: +6.5%
- Median List Price: $760,000
- Median List Price year over year: +0.1%
- Months of Supply (June 2025): 6.7
Jacksonville, Florida

- Active Listing Count year over year: +12.0%
- New Listing Count year over year: -4.3%
- Median List Price: $399,000
- Median List Price year over year: -2.6%
- Months of Supply (June 2025): 6.3
Tampa-St. Petersburg-Clearwater, Florida
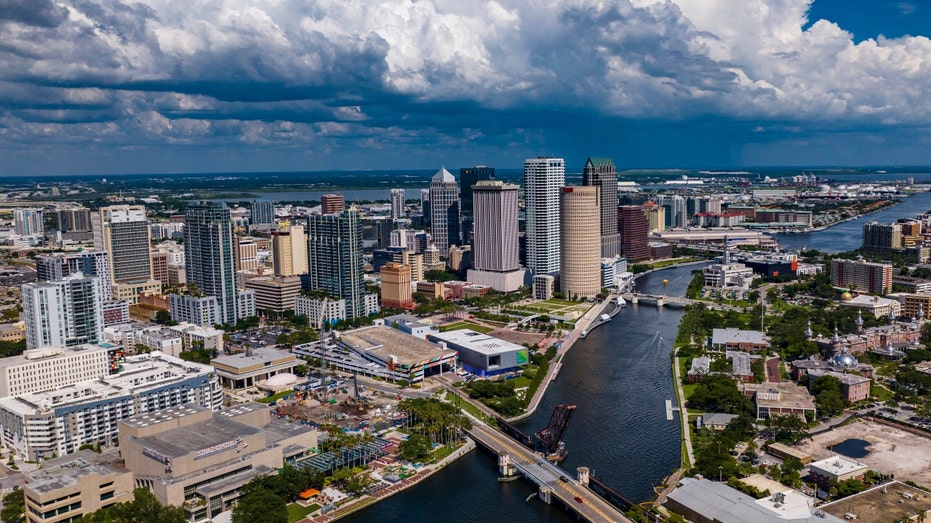
- Active Listing Count year over year: +16.3%
- New Listing Count year over year: -7.6%
- Median List Price: $415,000
- Median List Price year over year: 0.0%
- Months of Supply (June 2025): 6.3
Riverside-San Bernardino-Ontario, California
- Active Listing Count year over year: +30.4%
- New Listing Count year over year: -3.3%
- Median List Price: $599,000
- Median List Price year over year: 0.0%
- Months of Supply (June 2025): 6.1
Read the full article here


